
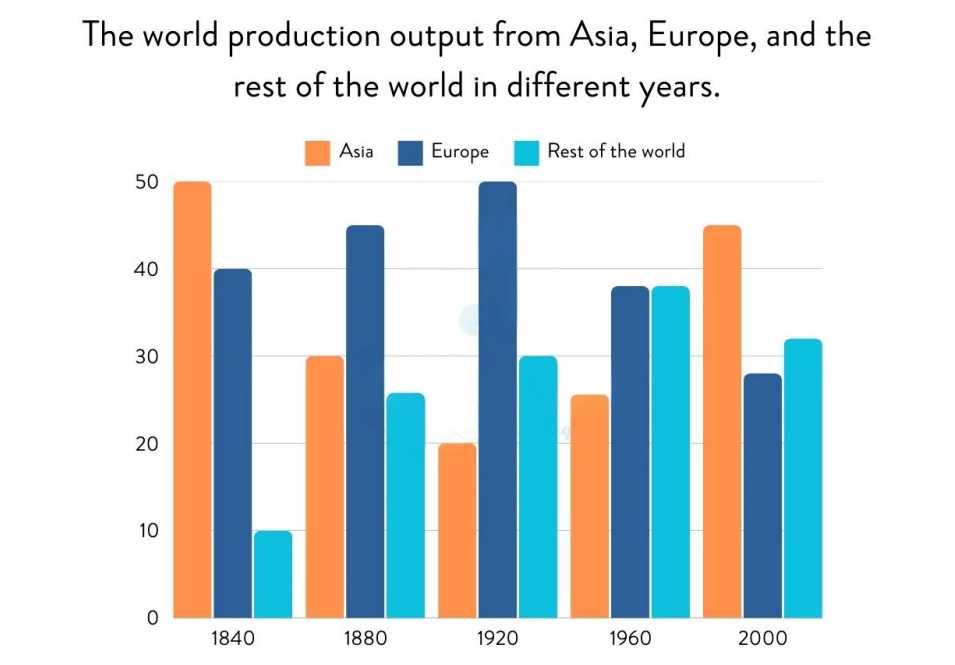
The bar chart illustrates the world production output from Asia, Europe, and the rest of the world in the years 1840, 1880, 1920, 1960, and 2000.
Overall, Asia had the highest production output in 1840 and 2000, while Europe dominated in 1920. The rest of the world showed a significant rise in production over the years, particularly from 1920 onwards.
In 1840, Asia accounted for approximately 50% of the world’s production, making it the largest contributor. Europe followed with around 40%, whereas the rest of the world had a minimal share, close to 10%. By 1880, Europe's production had increased significantly to become the leading region, surpassing Asia, while the rest of the world saw a slight rise.
In 1920, Europe reached its peak, contributing the highest share of global production at nearly 50%. Asia’s production fell to around 30%, and the rest of the world experienced a noticeable increase.
By 1960, Europe and the rest of the world had almost equal production outputs, both significantly higher than before. Asia’s share also began to rise again, though still lower than its peak in 1840. Finally, in 2000, Asia reclaimed the leading position, contributing the most to global production, followed by the rest of the world. Europe’s output, in contrast, had declined significantly compared to its peak in 1920.
Band 9 Sample Answer